- Home
- News & Updates
- Introducing Illumina Connected Insights v5.2
-
Illumina Connected Insights
-
Product updates
-
News
- 08/25/2025
Introducing Illumina Connected Insights v5.2
-
Allison MillerSoftware Product Marketing Manager
Enhanced compatibility, interpretation, and precision.
Illumina Connected Insights, Illumina’s flagship platform for oncology research variant interpretation and reporting, has evolved significantly over the past few years to empower our customers on their precision oncology journey. Illumina’s investment in turnkey oncology informatics solutions is one of many ways in which we continuously commit to enabling research for applications such as MRD, risk stratification, and tumor subtyping. Our latest release of Connected Insights version 5.2 brings that and more, making NGS accessible to a wider range of oncology labs with more accurate, meaningful answers.
Made available as of last month, Connected Insights v5.2 brings new capabilities for enhanced interpretation accuracy, sophisticated visualizations, and broader compatibility with downstream assays and analyses, including compatibility with non-Illumina datasets.
Connected Insights v5.2 features highlighted:
- Significant accuracy improvements in interpretation, leveraging prioritized evidence for distinct cancer subtypes, standardized user-defined variant classifications across KBs, and prioritization of approved options from other diseases
- Faster time to report and decreased variant review lists by up to 90%*, with new filtering capabilities by knowledge base and oncogenicity prediction, automated research reporting of therapies based on approval authority or clinical trials based on location
- Broader compatibility, allowing ingestion of non-Illumina datasets (Archer, PiVAT), DRAGEN HRD and v4.4 data
- Sophisticated new visualizations, providing karyogram/ideaogram plots, mutational signatures, and a view of filtered variants
Let’s dive into the specifics for a few of these Connected Insights v5.2 features - for more information, be sure to check out our video summary of the release and register for our upcoming oncology webinar.
Improvements in variant interpretation accuracy
Version 5.2 of Illumina Connected Insights introduces several significant gains when it comes to accuracy of variant prioritization and interpretation. Connected Insights can now:
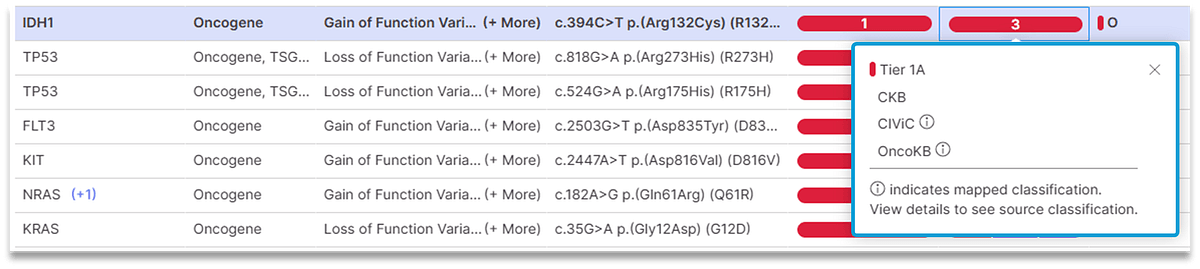
- Accurately match evidence for unspecified gene variants to variants with proven oncogenicity, preventing overinterpretation of begin or uncertain variants and making reports clearer
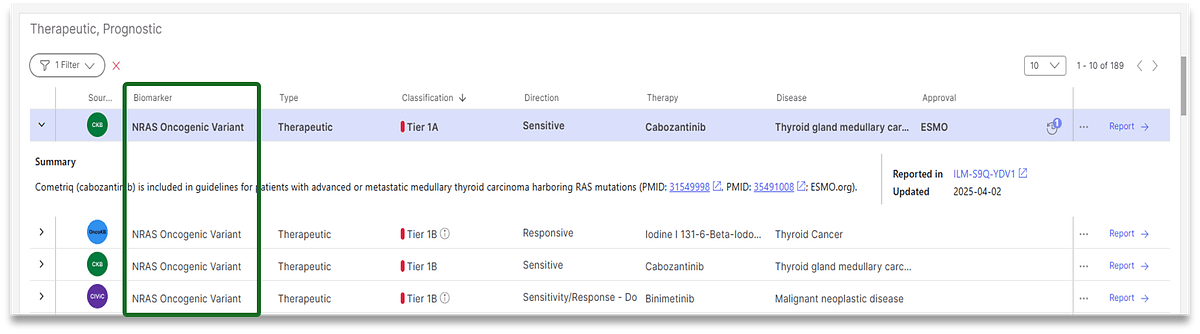
- Prioritize and report evidence for possible disease subtypes with greater precision as compared to previous versions, generating reports quicker
- Provide a consistent, user-defined classification system, reconciling multiple classifications across different biomarker knowledge bases into one easy to read report
Faster Insights
Building on functionality introduced in previous versions of Connected Insights, version 5.2 brings several new capabilities to reduce time spent reviewing variants and manually customizing reports. This includes the ability to:
- Filter variants by knowledge base and oncogenic prediction score, reducing your variant review list by up to 90%*
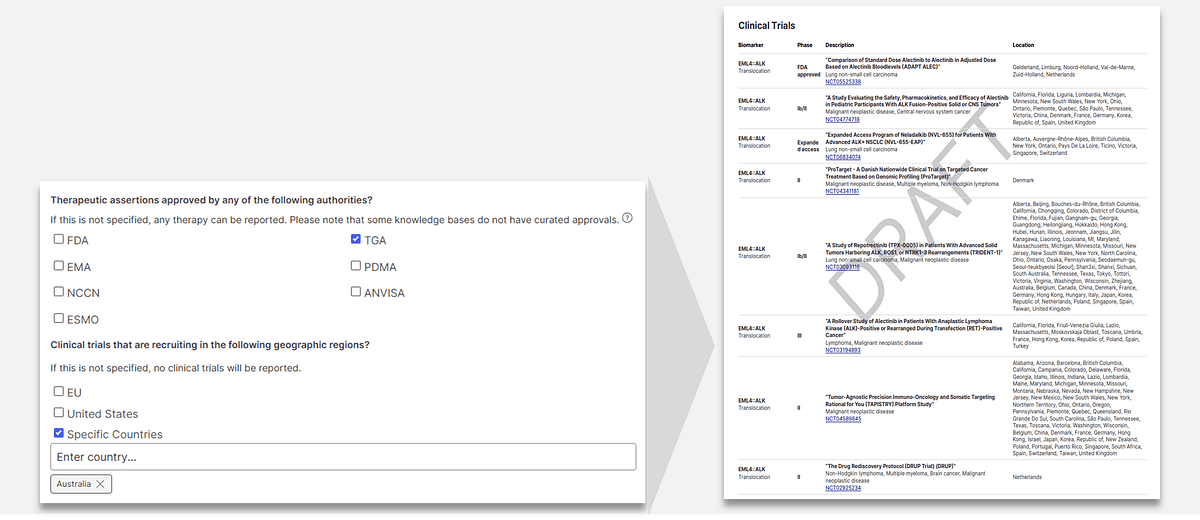
- Automate therapy research reporting based on region-specific approval authority (e.g., FDA, ESMO)
- Automate clinical trial reporting based on lab location
- Sort variants by genes alphabetically
*As compared to version 5.1 of Connected Insights
Broader compatibility:
Connected Insights meets you where your data is, providing flexibility to ingest and interpret data from a broad range of Illumina and non-Illumina assays and software. Version 5.2 introduced out-of-the box compatibility with the following datasets:
- Non-Illumina analyses data (Archer, PiVAT).
- DRAGEN v4.4 pipelines, including somatic and germline variant calling pipelines
- DRAGEN HRD scores
- TruSight Oncology 500 ctDNA MSI sumJSD
While our latest release expands upon out of the box data compatibility, Connected Insights has the capability to ingest any third-party dataset with customization. Please contact Illumina support with desired input files, and we are happy to work with you.
Sophisticated New Visualizations:
We know that visualizations are a key tool used by our customers in their variant interpretation workflow, providing a way to better explore spatial relationships, quickly assess variant coverage and other QC metrics, and ultimately understand the underlying genetic drivers of cancer. Connected Insights version 5.2 brings several new powerful visualization capabilities to its menu:
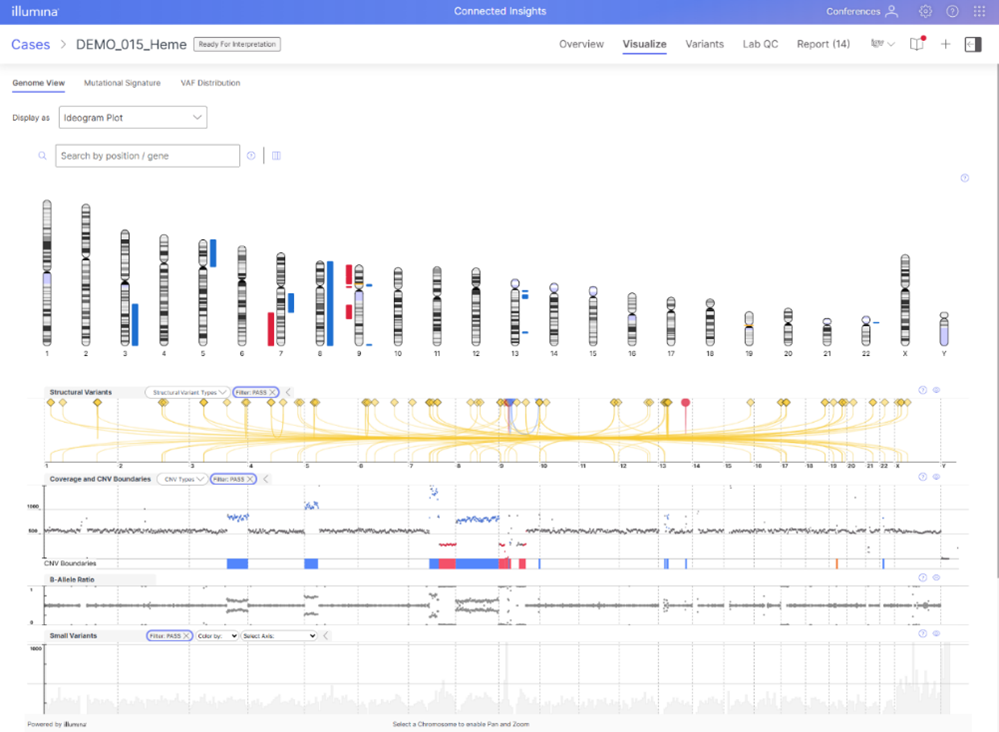
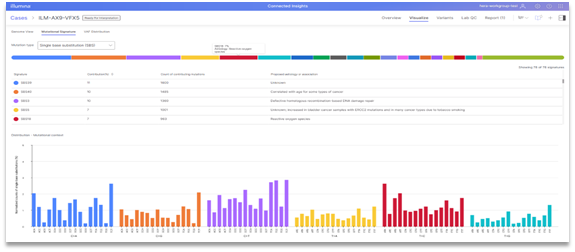
- Mutational signature plots, providing a view into high contribution and mutation counts which can support HRD/MSI status and suggest underlying cause of disease (e.g., smoking, UV damage)
- Ideogram/Karyogram plots, offering cytogeneticists an intuitive, genome-wide visualization of findings in a format they know and trust
- Ability to visualize filtered variants for faster interpretation
- Access to visualizations for supported reads, read depth, splice variants, break-point insertions and more all under the ‘variant details’ view
Learn More
Connected Insights is chock full of new capabilities, and we’ve just touched the surface. In addition to the features mentioned here, Version 5.2 includes other QC and reporting improvements. To learn more about all other capabilities included in the latest version released, view our release notes and check out our video summary.
Visit the Connected Insights webpage to learn more about our technology and speak with a Technical Specialist. If you are interested in connecting with us and the growing community of users, please also let us know!
For Research Use Only. Not for use in diagnostic procedures.
M-GL-03733