- Home
- News & Updates
- DRAGEN™ Array 1.0 now supporting Methylation QC analysis
-
DRAGEN™ Array
-
Product updates
-
News
- 05/13/2024
DRAGEN™ Array 1.0 now supporting Methylation QC analysis
Introduction
DRAGEN Array is a bioinformatics software suite from Illumina for accurate, comprehensive, and efficient analysis of Infinium microarray data. The software is for Research Use Only (RUO).
The latest DRAGEN Array release expands its capabilities, now enabling high-throughput and quantitative reporting of quality control (QC) metrics for Infinium methylation arrays.
Methylation Quality Control
For more than a decade, accurate and scalable Infinium methylation BeadChips have facilitated groundbreaking discoveries on the role of epigenetic mechanisms in human health and disease.1
Illumina offers multiple BeadChip options for epigenetic studies, including the Infinium Methylation Screening Array 48 and the Infinium MethylationEPIC BeadChip. The Infinium Methylation Screening Array-48 features broad coverage of known methylation associations for human traits, disease phenotypes, exposures, aging, and large-scale epigenetic analyses,2 while the Infinium MethylationEPIC BeadChip offers genome-wide coverage of known methylation sites.3
To measure the proportions of methylated and unmethylated cytosine bases using Infinium methylation BeadChips, the input DNA must first undergo bisulfite conversion where unmethylated cytosine bases are converted to thymine and methylated bases are retained as cytosine. The bisulfite-treated DNA is amplified and loaded onto an Infinium methylation array for the Infinium methylation assay and scanned on the iScan™ System.
QC analysis takes place after scanning and makes sure that the BeadChip data are measuring actual methylation differences and are not the result of experimental issues. The cloud-based DRAGEN Array Methylation QC software delivers high-throughput, quantitative reporting of control metrics for the array. DRAGEN Array Methylation QC software offers multiple features to ensure data quality and accelerate data workflows, including:
- 21 control metrics with adjustable thresholds to determine pass/fail status
- Informative data summary plots for a quick visual check of each analysis batch
- Automated determination of detection p-value, beta-values, and m-values from each methylation sample
- Convenient deployment on BaseSpace™ Sequence Hub, a cloud-based software with an intuitive interface for easy analysis kickoff
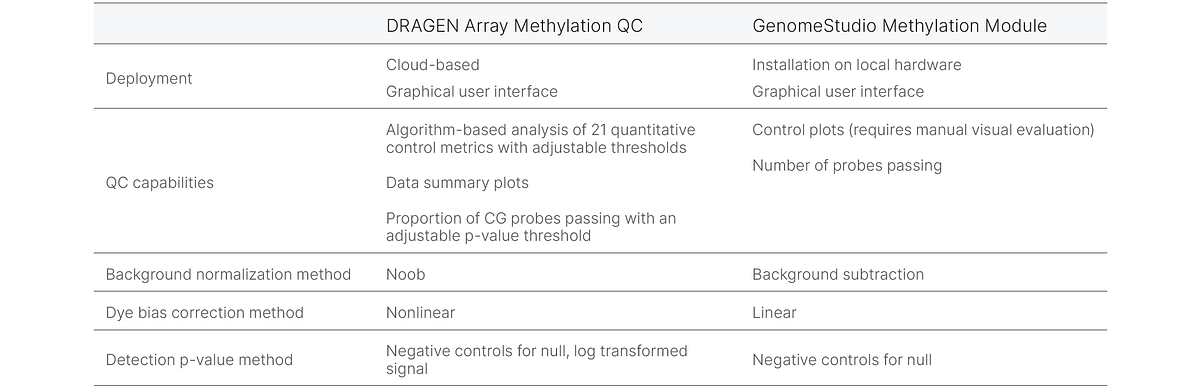
This article examines sample QC methods employed by DRAGEN Array Methylation QC software to determine data quality. Where applicable, these methods will be compared to the methods in GenomeStudio™ Methylation Module (Table 1).
Quantitative QC metrics
DRAGEN Array Methylation QC software features automated analysis of control probes included in Infinium methylation BeadChip content. These control probes are used to compute 21 metrics that help users assess individual aspects of BeadChip processing and sample performance. Within the results, the software provides information to identify issues with specific workflow steps, such as bisulfite conversion, staining efficiency, and extension (Table 2). The sample-dependent controls evaluate sample quality and performance, while the sample-independent controls evaluate the quality of specific steps in the process flow.
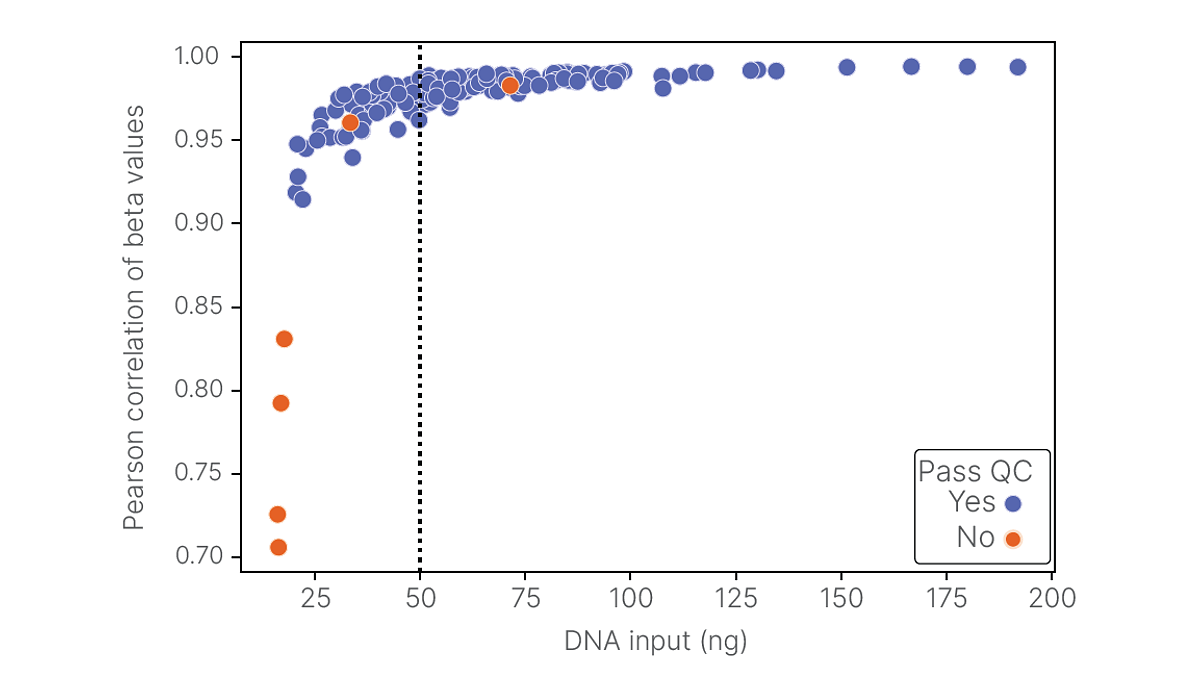
The software can automatically identify samples with failing performance metrics. Failing samples tend to have low DNA input quantity and low beta-value correlation with the associated higher input replicates (Figure 1). The automated analysis is more efficient than existing BeadChip workflows that begin with a manual QC analysis, including the GenomeStudio Methylation Module workflow. The automation also removes variability associated with subjective human analysis.
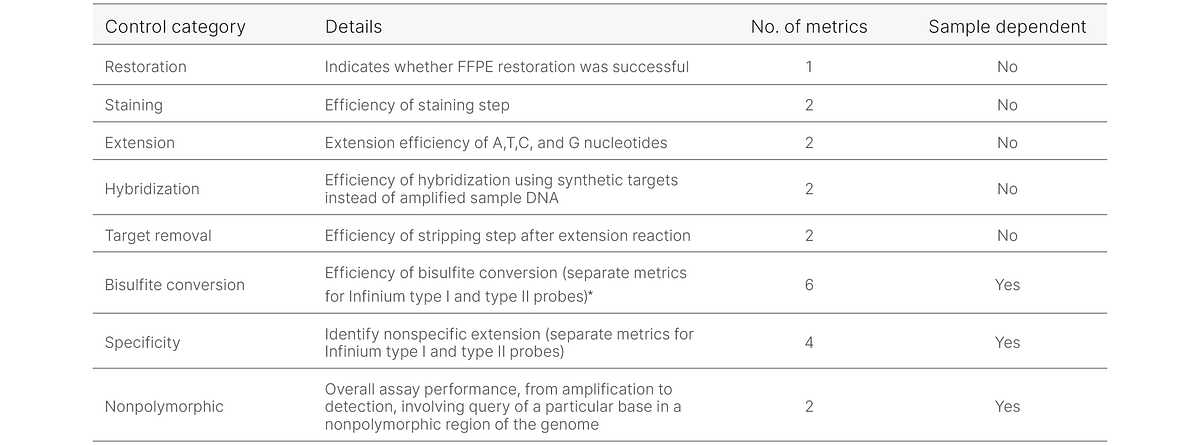
(*Illumina Methylation BeadChips achieve breadth of coverage using two Infinium™ Chemistries. Published 2022. Accessed April 8, 2024.)
Updated methylation QC pipeline
DRAGEN Array Methylation QC software produces dependable pass/fail detection of probes on Infinium methylation BeadChips due to improved background normalization, dye bias correction, and detection p-value calculation.
Background normalization
DRAGEN Array Methylation QC software uses normal-exponential convolution on out-of-band probes (Noob) for background detection. The Noob method models out-of-band signal from thousands of Infinium I probes across the BeadChip to achieve a more accurate background calculation than the background subtraction method used in the GenomeStudio Methylation Module that models a limited number of negative control probes. Noob has been shown to have lower probe-level variation across replicates than the background subtraction method, supporting more accurate signal estimates.4, 5
Dye bias correction
Infinium methylation arrays use signals from Cy3 (green) and Cy5 (red) dyes to measure methylation levels at CpG sites. These dyes perform differently in the assay and a dye bias step correction must be performed before methylation levels can be accurately determined. DRAGEN Array Methylation QC uses nonlinear dye bias correction for differences in red/green channel signal that is an improvement over the linear dye bias correction used in the GenomeStudio Methylation Module.6
Detection p-value threshold
The detection p-value threshold indicates the probability that the signal is background noise. A cutoff of p < 0.05 is usually recommended for detection p-values. For calculating detection p-values, DRAGEN Array Methylation QC models the null distribution by fitting a normal distribution to the log of the signal intensity of the negative control probes.
DRAGEN Array Methylation QC controls false positive rate
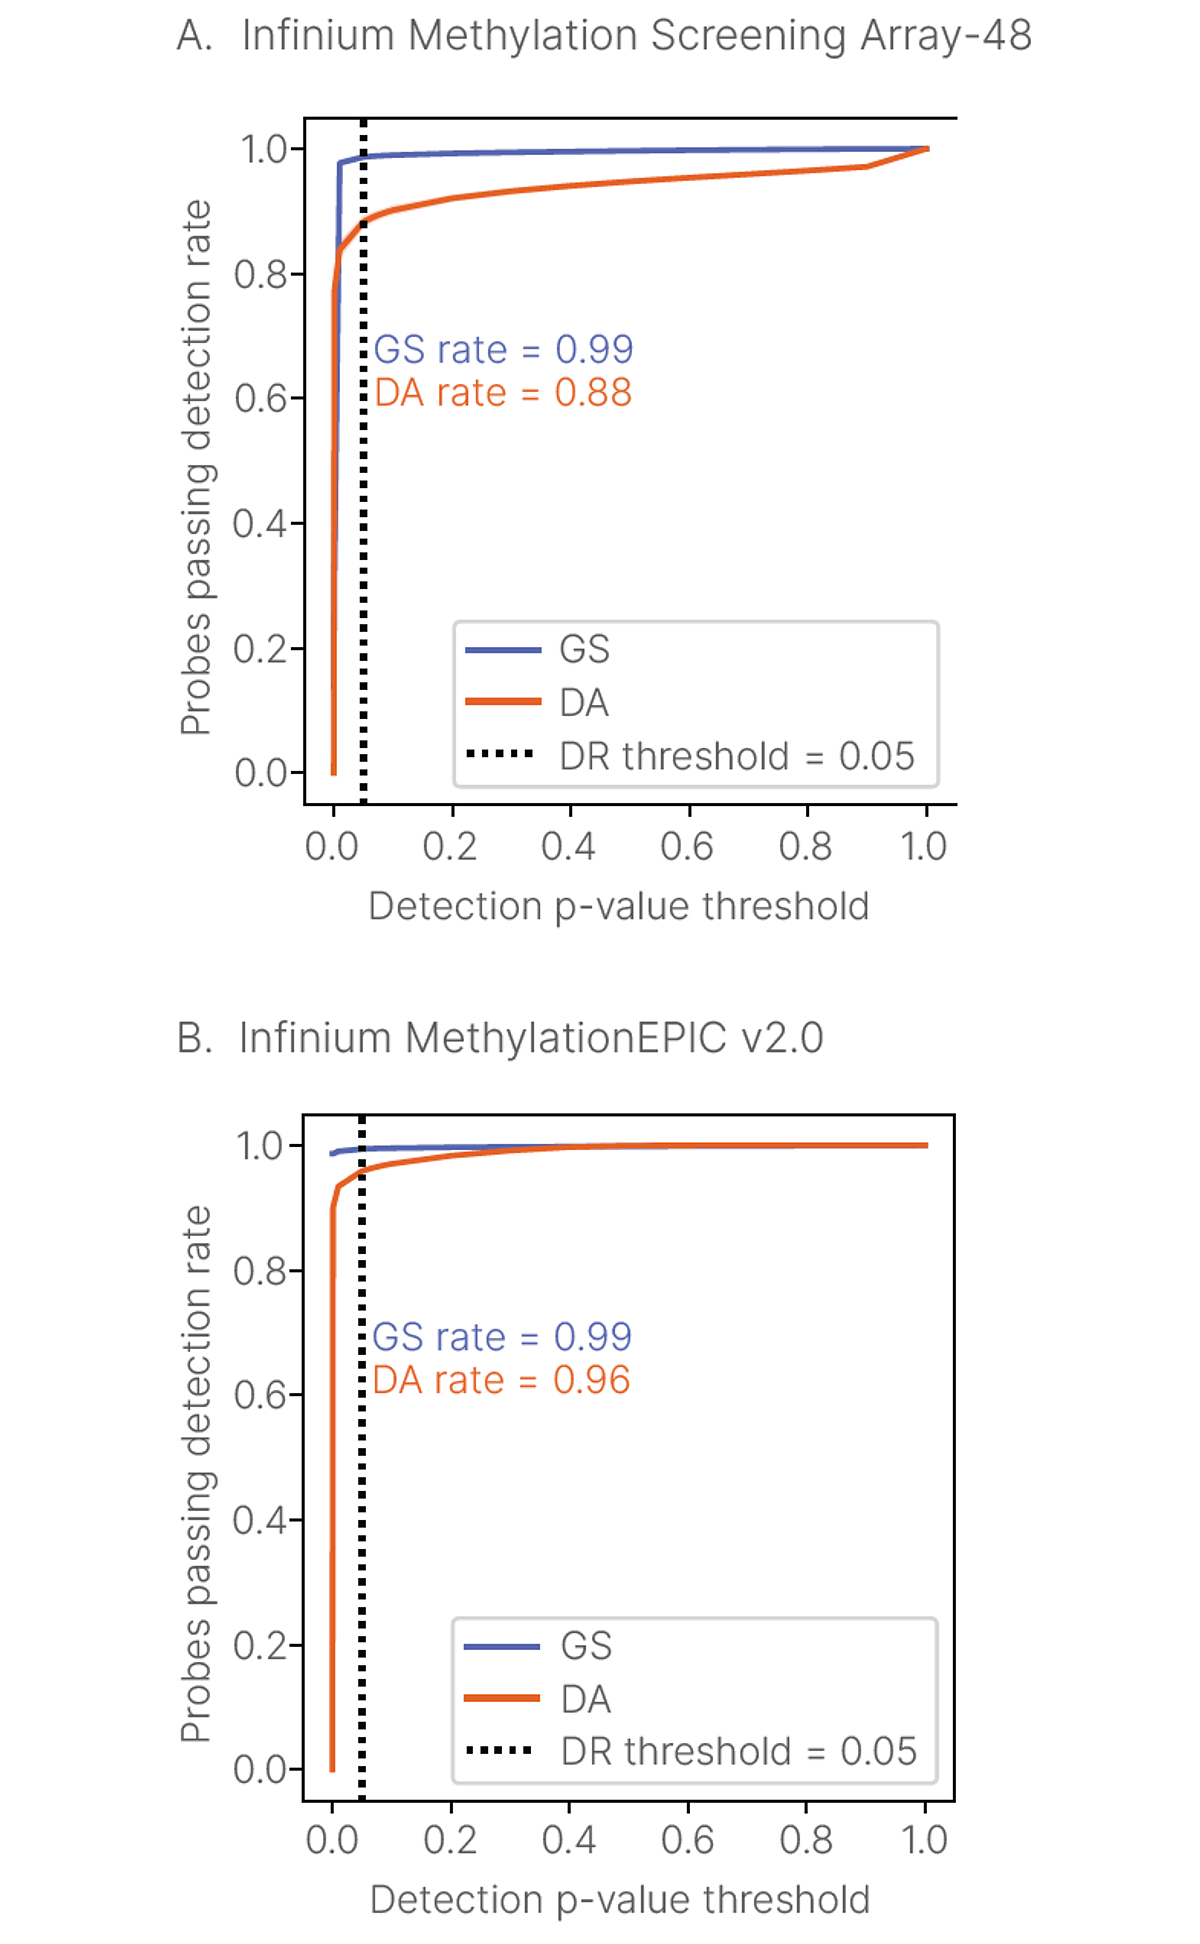
DRAGEN Array Methylation QC software calculates background normalization, dye bias correction, and detection p-value differently in comparison to the GenomeStudio Methylation Module, leading to differences in detection p-values. DRAGEN Array Methylation QC analysis results in lower probes passing detection p-value rates (Figure 2), with the resulting data being higher quality with lower false positive results.
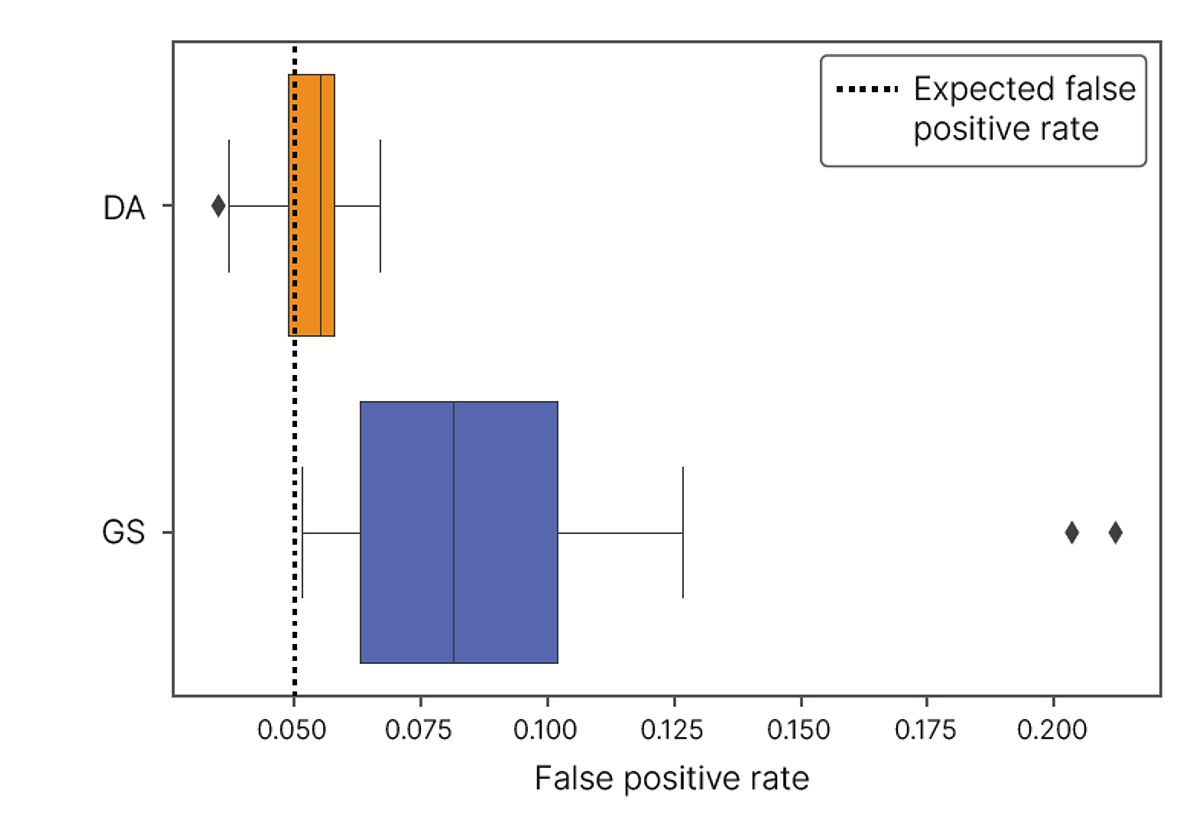
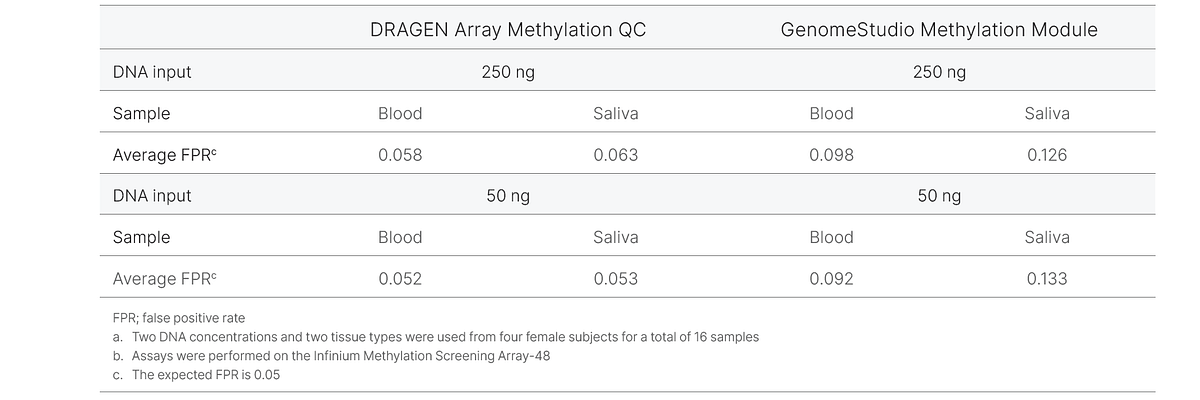
To demonstrate the improvements in DRAGEN Array Methylation QC analysis, we examined the rate of Y-chromosome probes passing detection using two different sample types at two different input DNA amounts from four female subjects. Using data run on the Infinium Methylation Screening Array-48, we calculated the Y-chromosome false positive rate as the proportion of probes passing a detection threshold p-value = 0.05. The empirical false positive rates for DRAGEN Array Methylation QC and GenomeStudio Methylation Module were compared with the expected false positive rate (0.05). In this analysis, the DRAGEN Array Methylation QC results are closer to the expected false positive rate of 0.05 for all samples compared to the GenomeStudio Methylation Module, which produces a higher false positive rate (Figure 3, Table 3). This experiment demonstrates that DRAGEN Array Methylation QC produces a lower false positive rate, resulting in higher-quality data for downstream analysis.
Summary
DRAGEN Array Methylation QC is a cloud-based software recommended for the analysis of Infinium methylation arrays. In comparison to the local-based GenomeStudio Methylation Module, automated analysis using DRAGEN Array Methylation QC allows labs to conduct higher throughput methylation QC analysis and more consistently and effectively assess data quality. DRAGEN Array Methylation QC analysis of Infinium methylation control probes generates easy-to-interpret results assessing sample and BeadChip processing procedures, and provides raw data that can be used for troubleshooting when needed. As demonstrated in this article, the optimized QC algorithms of DRAGEN Array Methylation QC result in better data sets for improved downstream analysis.
Learn more
Contact Illumina Customer Care
--
M-GL-02644 v1.0
- Wei S, Tao J, Xu J, et al. Ten Years of EWAS. Adv Sci (Weinh). 2021;8(20):e2100727. doi:10.1002/advs.202100727. www.pubmed.ncbi.nlm.nih.gov/34382344/
- Illumina. Infinium Methylation Screening Array. www.illumina.com/content/dam/illumina/gcs/assembled-assets/marketing-literature/infinium-methylation-screening-array-data-sheet-m-gl-01893/infinium-methylation-screening-array-data-sheet-m-gl-01893.pdf. Published 2024. Accessed March 20, 2024.
- Illumina. Infinium MethylationEPIC v2.0 BeadChip. www.illumina.com/content/dam/illumina/gcs/assembled-assets/marketing-literature/infinium-methylation-epic-data-sheet-m-gl-01156/infinium-methylation-epic-data-sheet-m-gl-01156.pdf. Published 2022. Accessed March 20, 2024.
- Triche TJ Jr, Weisenberger DJ, Van Den Berg D, Laird PW, Siegmund KD. Low-level processing of Illumina Infinium DNA Methylation BeadArrays. Nucleic Acids Res. 2013;41(7):e90. doi:10.1093/nar/gkt090, Fortin JP, Triche TJ Jr, Hansen KD. www.pubmed.ncbi.nlm.nih.gov/23476028/
- Preprocessing, normalization, and integration of the Illumina HumanMethylationEPIC array with minfi. Bioinformatics. 2017;33(4):558-560. doi:10.1093/bioinformatics/btw691. www.ncbi.nlm.nih.gov/pmc/articles/PMC5408810/
- Zhou W, Triche TJ Jr, Laird PW, Shen H. SeSAMe: reducing artifactual detection of DNA methylation by Infinium BeadChips in genomic deletions. Nucleic Acids Res. 2018;46(20):e123. doi:10.1093/nar/gky691. www.pubmed.ncbi.nlm.nih.gov/30085201/