- Home
- News & Updates
- BaseSpace™ Sequence Hub: does my sequencing run look good?
-
BaseSpace™ Sequence Hub
-
News
- 06/14/2021
BaseSpace™ Sequence Hub: does my sequencing run look good?
-
Sophie Wehrkamp-Richter
Today, we’re sharing the first in a series of posts that will shed more light on new run data publicly available on BaseSpace™ Sequence Hub (BSSH).
A question we often get is whether a sequencing run looks good. In this post, we’d like to share some ways to evaluate a sequencing run. In this deep dive, we will use public data from BaseSpace™ Sequence Hub (BSSH) to take a closer look at some sequencing metrics.
Overall sequencing run performance is evaluated by determining whether the sequencing run meets the Illumina® specifications for quality scores and data output. Actual run performance will vary based on sample type, quality, and clusters passing filter. Specifications are based on the Illumina® PhiX control library at supported cluster densities (for non patterned flowcell) or cluster passing filters (%) for patterned flowcell.
A good starting point is to look at the instrument specifications, which are a baseline for what you should expect. Follow the links below to the instrument specification pages: iSeq™ 100 | MiniSeq™ | MiSeq™ | MiSeqDx™ | NextSeq™ 500/550 | NextSeq 550Dx | NextSeq 1000/2000 | HiSeq™ 1000/1500/2000/2500 | HiSeq 3000/4000 | HiSeq X | NovaSeq™ 6000
To dive deeper, we will take a look at Demo Data from a NextSeq™ 2000 run, analyzing samples prepared with Illumina® DNA PCR-Free (whole genome sequencing). To follow along, please refer to the post “Demo Data Page on BaseSpace™ Sequence Hub” to see how to access numerous publicly available runs.
When reviewing a sequencing run, the first step is to understand if the run is meeting Illumina® specifications (or “specs”) by checking the summary tab, which includes the data output (=yield) and the Q30 score. The summary tab can be found under the NextSeq™ 2000 run of interest.
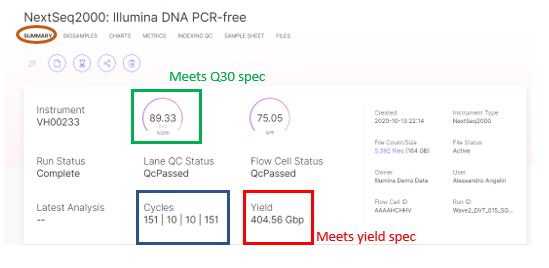
With a 89.33% of bases called with a quality score of 30 or higher, the run exceed the Q30 specification for a NextSeq™ 2000 2*150bp run, as the percent Q30 is ≥ 75%. With a yield = 404.56Gbp, the run also exceeds yield specification (higher than 330 gigabases (Gb)).
To gain additional knowledge of the run, such as data by cycle or by lane, check the chart tab as well as the metrics tab. These tabs are very informative to troubleshoot or understand better a run.
The chart tab is an overview of the run metrics. You can expand a chart by clicking the expand button.
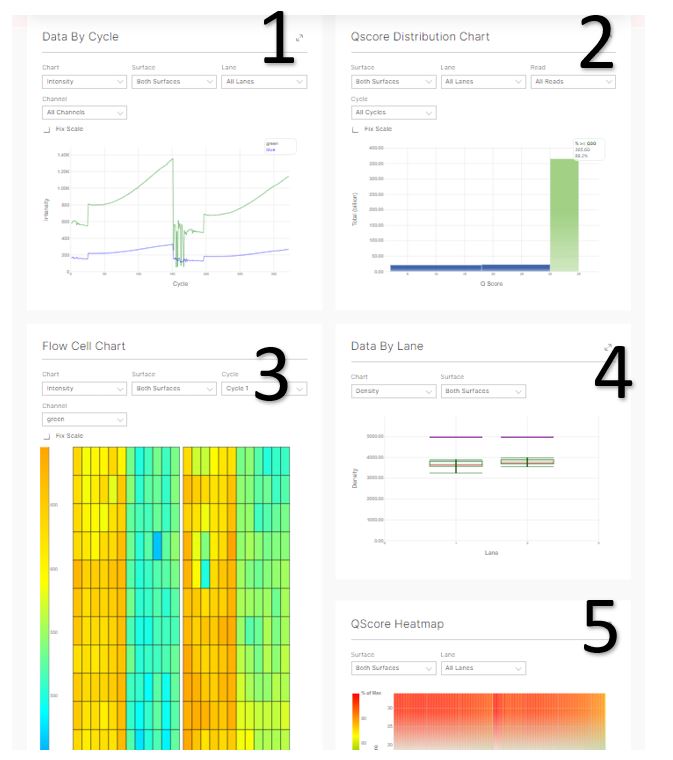
- Data by Cycle displays various metrics for each cycle of the run and can be used to judge the progression of quality metrics during a run on a cycle by cycle basis.
Select the displayed metric, lane, surface, and channel using the drop-down lists.
2. Q Score Distribution shows a quick overview of the quality of the run. The Q30 for the whole run is found in the upper right of this box.
3. Use the Flow Cell Chart to judge local differences per cycle, per lane, or per read in sequencing metrics on a flow cell. It is also an easy way to see the %Q30 metric, which is an excellent single metric to judge a run.
4. Data by Lane shows plots of metrics per lane and allows to judge the difference in quality metrics between lanes.
5. Q score Heatmap displays a heat map for Q score by cycle and allows a quick overview of the Q-scores over the cycles. Red spots are high quality.
The metrics tab provides basic data quality metrics summarized per lane and per read.
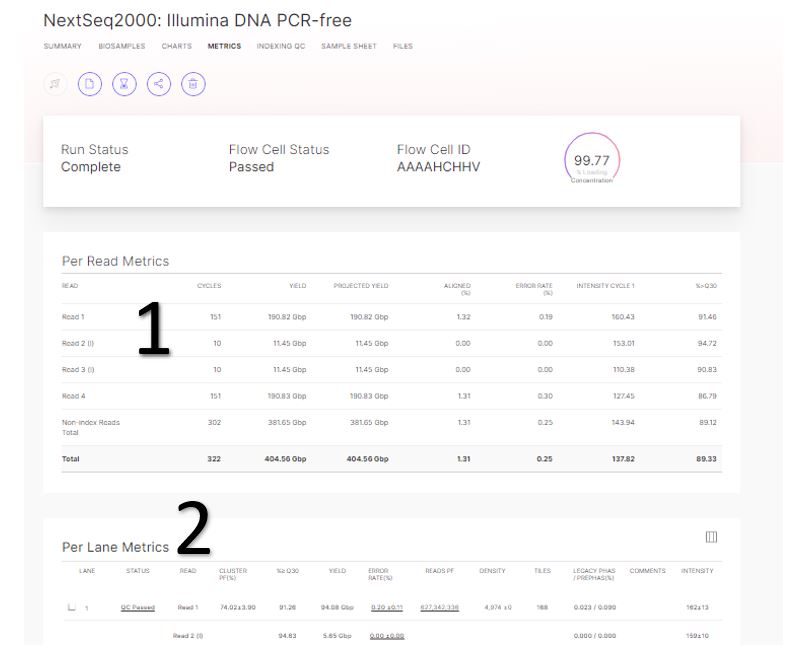
- Run metrics per read, including quality, is reported here.
- Per lane metrics indicate more details per lane including clusters Passing Filter (PF), and % of reads aligned to the PhiX control.
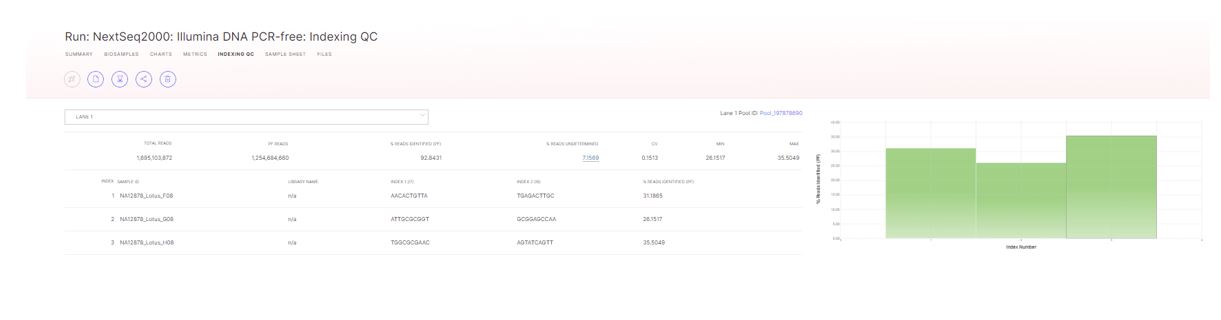
Finally, the indexing tab allows to gain information on the representation of each sample in the run, if a sample sheet was used and demultiplexing was performed.
If you have questions or concerns about your run, please contact Illumina® support (techsupport@illumina.com). Highly trained scientists will be able to review the run with you and offer some troubleshooting assistance, if necessary.
Other posts from the blog series: new run data publicly available on BaseSpace™ Sequence Hub (BSSH).
- https://blog.software.illumina.com/2021/06/17/demo-data-on-illumina-basespace-sequence-hub/
- https://blog.software.illumina.com/2021/06/21/10x-genomics-chromium-single-cell-multiome-atac-gene-expression-data-now-available-on-illumina-basespace-sequence-hub/
Products mentioned here are for research use only, and are not for diagnostic use.