- Home
- News & Updates
- Illumina Connected Insights 5.4: Advancing Scalable Oncology Interpretation and Unlocking MRD Insights
-
Illumina Connected Insights
-
Product updates
-
News
- 06/11/2026
Illumina Connected Insights 5.4: Advancing Scalable Oncology Interpretation and Unlocking MRD Insights
-
Allison MillerSoftware Product Marketing Manager
As oncology research continues to scale, labs are increasingly looking to track disease over time quickly and consistently, especially in applications like minimal residual disease (MRD).
With Connected Insights 5.4, we’re continuing to reduce friction in variant interpretation and reporting while expanding flexibility across workflows. Building on the automation introduced in version 5.3, this release introduces enhanced reporting automation, expanded DRAGEN pipeline support, and new longitudinal capabilities that enable MRD research at scale.
Below, we’ll highlight what’s new and how these advancements help labs attain more dynamic, longitudinal insights in the context of cancer research.
Release Highlights
Connected Insights 5.4 introduces several key enhancements designed to improve flexibility, automation, and insight generation:
- Longitudinal analysis for MRD: Track key MRD like metrics (eVAF), maximum somatic variant allele frequencies, and individual disease progression across multiple timepoints.
- Expanded DRAGEN pipeline support: Leverage the latest advances in variant calling, multiomic analysis, and signal detection directly within Connected Insights
- Enhanced reporting automation: Automate variant classification using oncogenicity predictions and quick reporting from the variants table
- Improved variant context and biological interpretation: Expanded origin classification (somatic, germline, CHIP) and origin-specific evidence filtering
- Visualization improvements: Enhanced Circos plots and genome browser improvements
- Virtual panels for focused interpretation: Disease or custom gene set interpretations
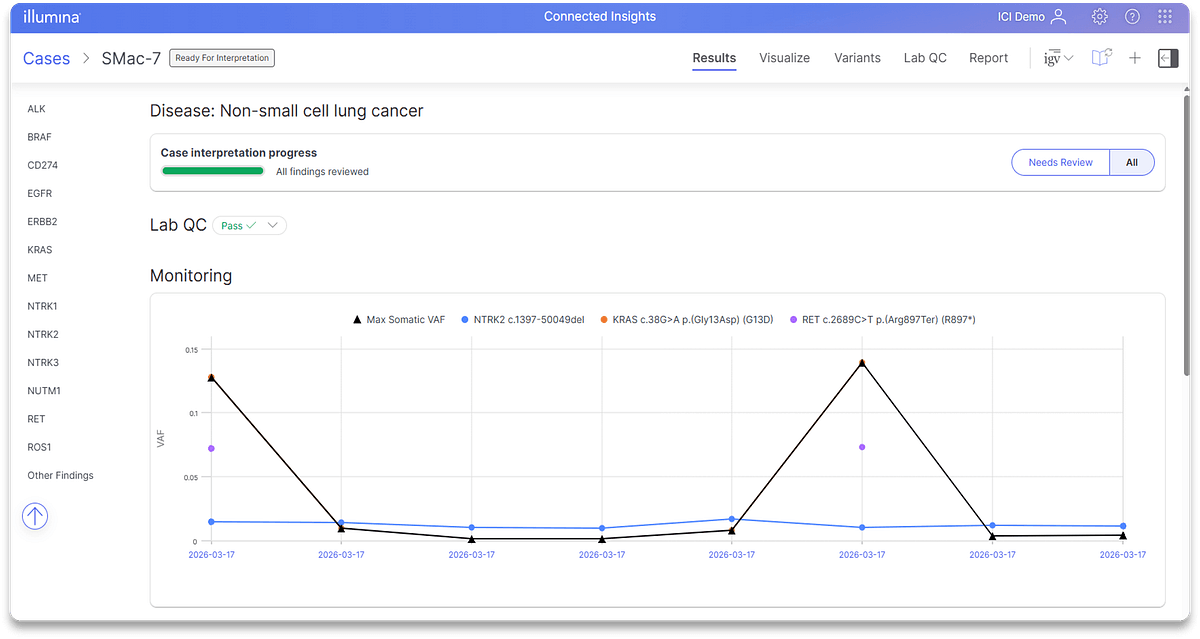
Supporting MRD Research with Longitudinal Analysis
Connected Insights v5.4 represents the first full release to introduce MRD-focused capabilities, combining support for DRAGEN MRD pipelines with built-in longitudinal analysis tools.
A new Longitudinal View enables tracking of:
- MRD-related metrics (eVAF)
- Maximum somatic VAF
- Variant-level changes across related cases
Interactive visualizations support analysis across up to 50 cases per subject, enabling a more complete view of disease over time.
Why this matters:
- Establishes a foundation for MRD research workflows within Connected Insights
- Enables tracking of tumor burden and molecular changes over time
- Supports analysis of longitudinal datasets generated from DRAGEN MRD pipelines
- Moves beyond single-sample interpretation toward time-series analysis
By integrating MRD detection with longitudinal visualization, Connected Insights enables a shift from single-sample interpretation to time-resolved analysis, helping uncover patterns in tumor evolution and disease progression across the cancer journey.
Expanding Pipeline Support with DRAGEN v4.5 and MRD
Connected Insights 5.4 extends compatibility with the latest DRAGEN pipelines, including:
- DRAGEN v4.5 applications, spanning amplicon, somatic WGS/enrichment, RNA, and custom panel workflows
- DRAGEN WGS MRD v4.4.6
- TSO 500 ctDNA v2.6.4 (including GRCh38)
By supporting these pipelines, Connected Insights enables users to interpret and report variants generated using the latest advances in secondary analysis, including improved accuracy, signal detection, and support for complex genomic regions.
This includes DRAGEN improvements designed to:
- Reduce noise and improve accuracy in complex genomic regions
- Extract deeper biological signals from challenging samples
- Expand capabilities across oncology and multiomic research applications
By extending compatibility with the latest DRAGEN pipelines, Connected Insights accepts outputs from state-of-the-art DRAGEN algorithms, ingesting and reporting MRD data alongside other assay types within a single platform. This integration helps reduce fragmentation between upstream secondary analysis processing and downstream variant interpretation, creating a more streamlined and cohesive end-to-end analysis experience.
To learn more about what’s new in DRAGEN v4.5, explore our latest press release here.
Improving Interpretation Efficiency and Automation
Connected Insights version 5.4 continues to reduce manual effort through enhanced automation and workflow improvements:
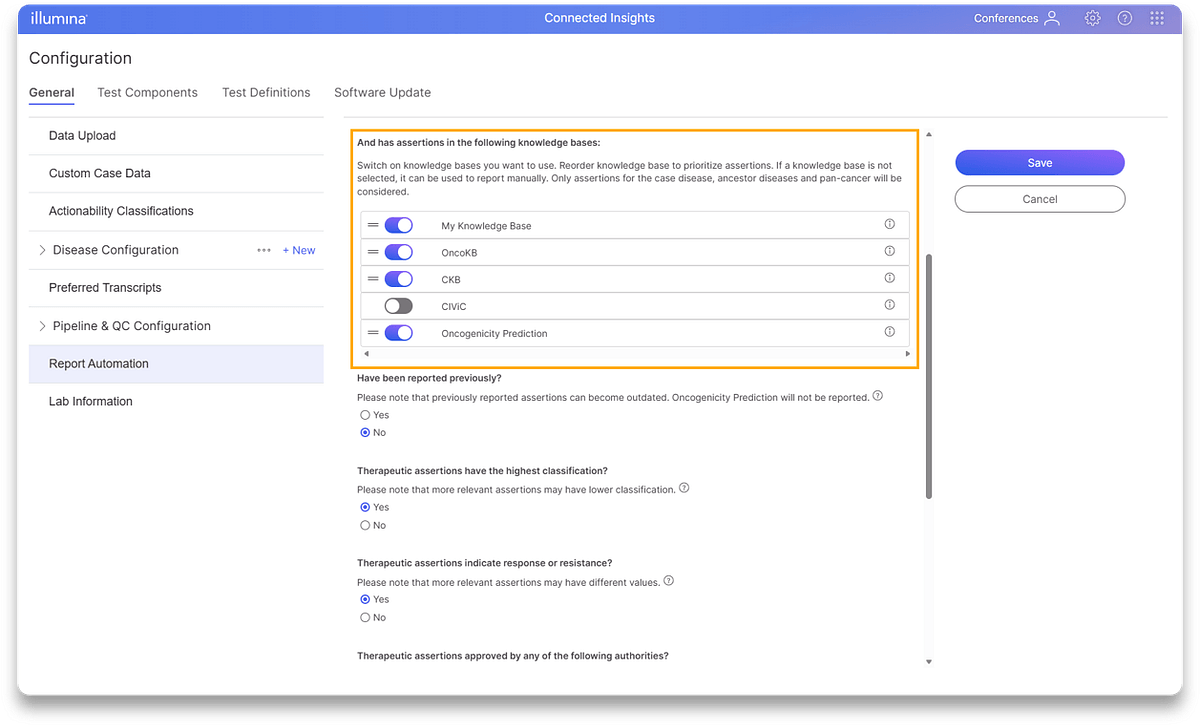
Automated oncogenicity-based research reporting
Oncogenicity predictions can now be used directly as a source for report automation, enabling automatic reporting of variants classified as oncogenic, likely oncogenic, or VUS.
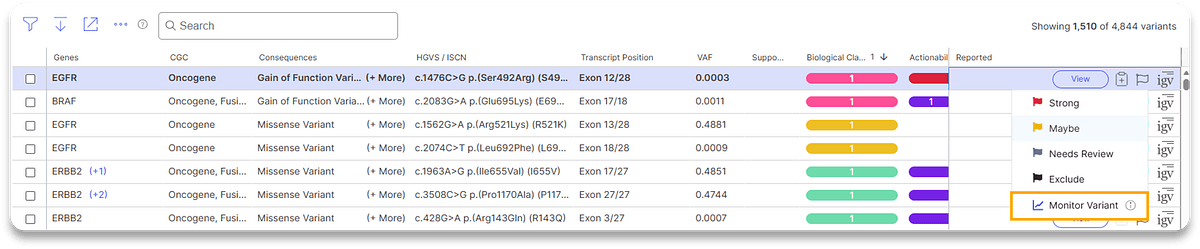
Quick reporting from the variant table
Variants can now be added to reports directly from the Variants tab using automation rules. This enables users to:
- Speed up variant interpretation and reporting workflows
- Reduce repetitive manual steps
- Improve consistency across outputs
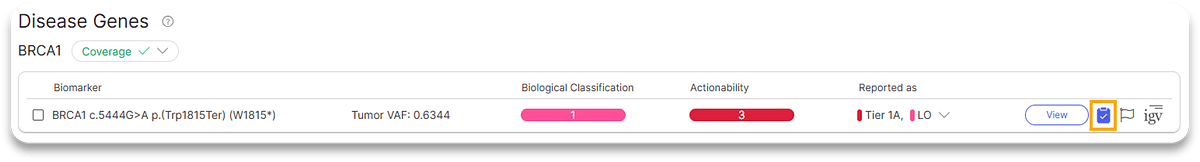
Enhancing Biological Context for More Confident Interpretation
The latest release of our flagship oncology platform also introduces several improvements that enhance how variant context is represented during the variant annotation and interpretation process. This consists of:
- Expanded variant origin classification, now recognizing CHIP and germline proxy variants
- Variant origin–specific assertions, enabling evidence filtering based on somatic or germline biological context
Together, these updates provide clearer insight into variant relevance, improving interpretation accuracy and streamlining report generation.
Enhancing Analysis with Improved Visualizations and Virtual Panels
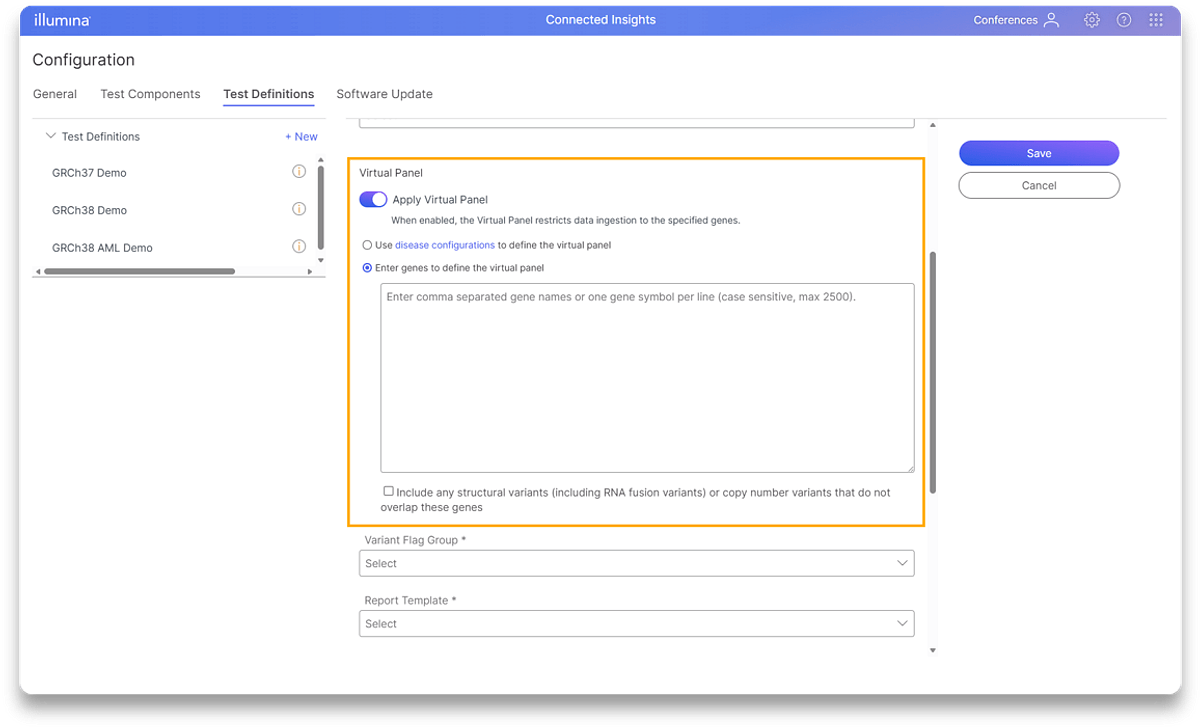
Virtual Panels:
A new Virtual Panels capability allows labs to perform more focused and flexible variant interpretation. This includes a custom gene set definition, with users defining panels based on:
- Disease-specific configurations
- Custom, user-defined gene lists
Virtual Panels streamline the journey to insights by allowing users to tailor their interpretation specific diseases or research questions, improving efficiency and ensuring focus on the most relevant genomic signals.
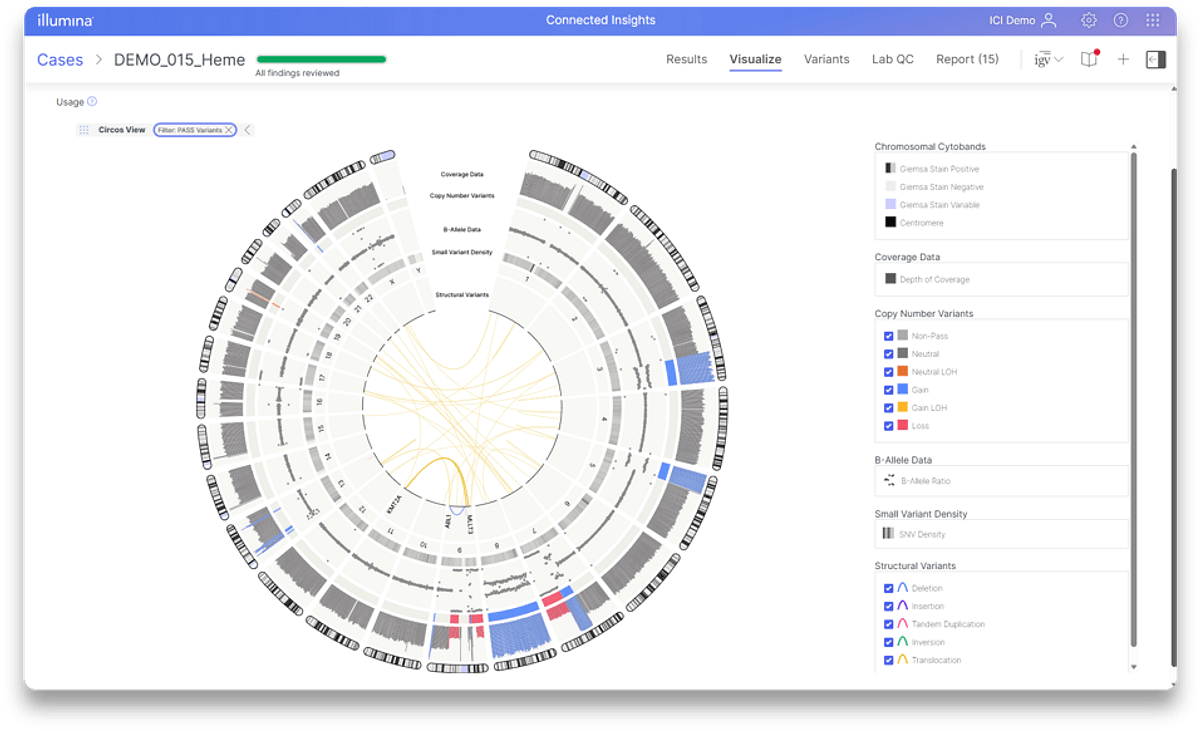
Visualization Improvements:
Connected Insights 5.4 also brings updates to visualization and genome browsing, including:
- Improved Circos plot visualization for structural variant interpretation
- Support for base mismatch display in BAM files without duplicates marketd, increasing compatibility across datasets
- Interactive longitudinal visualizations enabling users to visualize MRD-related metrics (eVAF, maximum somatic VAF) and variant-level changes across timepoint, supporting analysis across up to 50 cases per subject
These enhancements help users more effectively explore and interpret complex genomic data.
Final Thoughts
As oncology research continues to evolve, the ability to connect insights across time and samples is becoming increasingly important.
With the addition of MRD-enabled workflows and enhancements to visualizations and reporting, Connected Insights is evolving from a static interpretation platform to one that supports researching the progression of disease over time - integrating diverse assay types and pipelines, and reducing the manual interpretation burden.
Getting Started
Connected Insights v5.4 is now available. To explore these features:
For Research Use Only. Not for use in diagnostic procedures.
M-GL-04499