- Home
- News & Updates
- Analyze BioLegend Cell Hashing/TotalSeq libraries with Illumina® DRAGEN™ Single Cell RNA on Illumina BaseSpace™ Sequence Hub
-
DRAGEN
-
Publications
-
Product updates
- 10/09/2023
Analyze BioLegend Cell Hashing/TotalSeq libraries with Illumina® DRAGEN™ Single Cell RNA on Illumina BaseSpace™ Sequence Hub
Here, we demonstrate how to leverage the DRAGEN (version 4.2) Single Cell RNA app on BSSH to analyze BioLegend TotalSeq library sequencing data with cell hashing and feature counting.
CITE-seq (cellular indexing of transcriptomes and epitopes) is a sequencing-based method that simultaneously quantifies cell surface protein and transcriptomic data within a single cell readout. When paired with cell hashing, CITE-seq allows multi-omics (mRNA and surface protein) characterization for multiplexed bio samples. The increasing complexity of the library components, and larger scale of the dataset present additional challenges in data processing and management for single cell researchers. We recently published NovaSeq™ 6000 and NextSeq™ 2000 sequencing runs with BioLegend TotalSeq libraries on BaseSpace Sequence Hub (BSSH) demo data page (see our previous blogpost). Today, we show data analysis with DRAGEN 4.2 using the Single Cell RNA analysis pipeline (Figure 1). The analysis project can be found here: https://basespace.illumina.com/s/MPi9u6ptEwrz

Figure 1. The DRAGEN single cell RNA pipeline with cell hashing and feature counting modules.
The 10x Genomics Single Cell 3’ Reagent Kit v3.1 (used with TotalSeq-A and -B) and the Chromium Next GEM Single Cell V(D)J Reagent Kits v1.1 (used with TotalSeq-C) were used for scRNA isolation. Please note that this data set was generated using 10x Genomics single index libraries. TotalSeq A libraries were generated according to manufacturer’s instructions and BioLegend’s TSA single index protocol. In consideration that 10x has discontinued the single index assays, please note that BioLegend now offers an alternative dual index TSA protocol and TotalSeq-B or -C for use with 10x Genomics dual indexing kits that users can use moving forward.
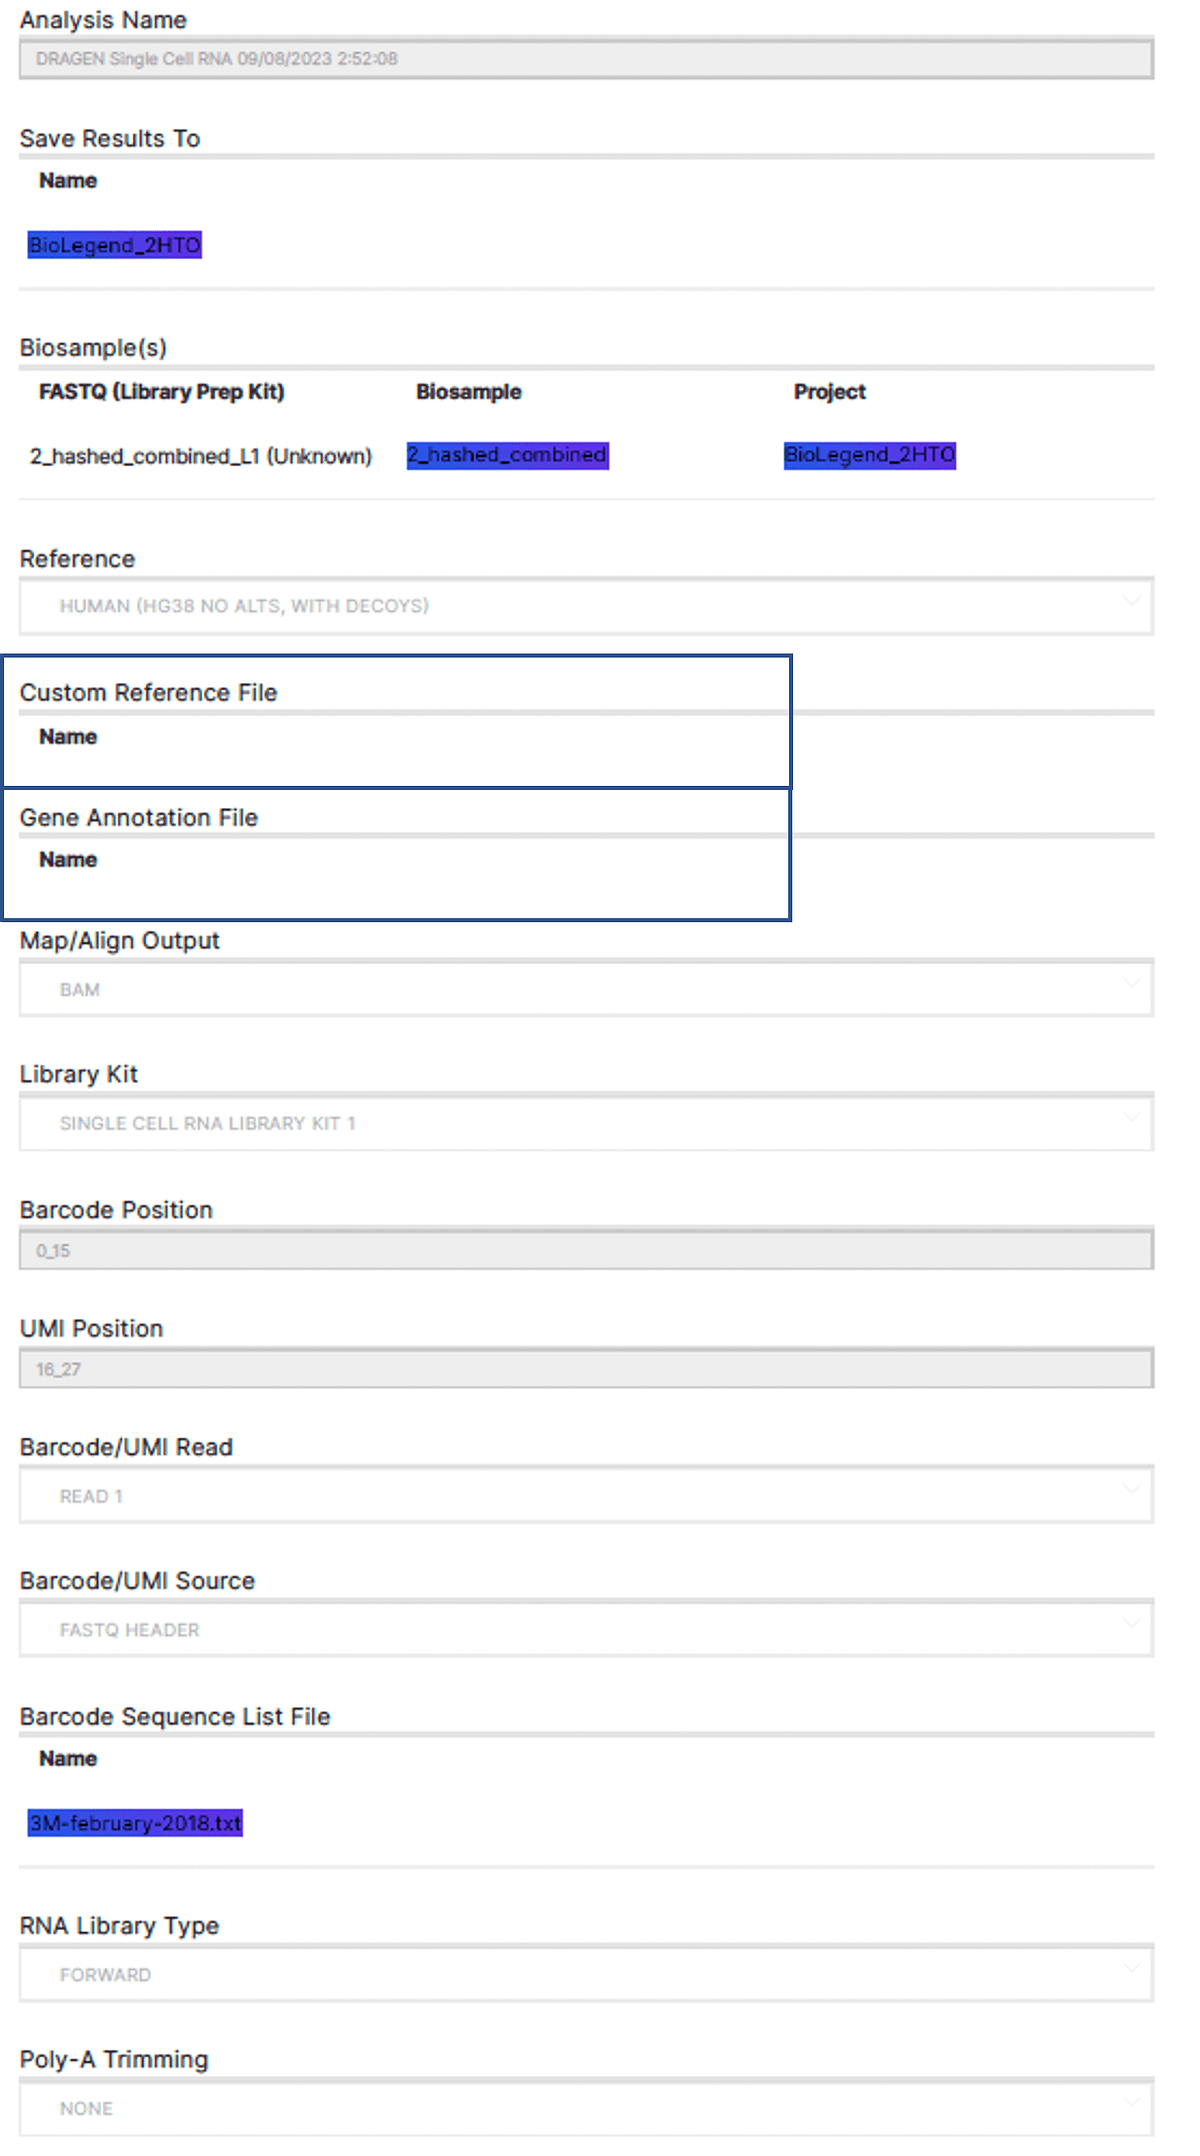
All the analysis settings can be found in the input section of the analysis. Briefly, DRAGEN scRNA app requires biosamples, reference genome, library kit information, cell barcode whitelist file, feature barcode reference and cell hashing reference to kick off the analysis.
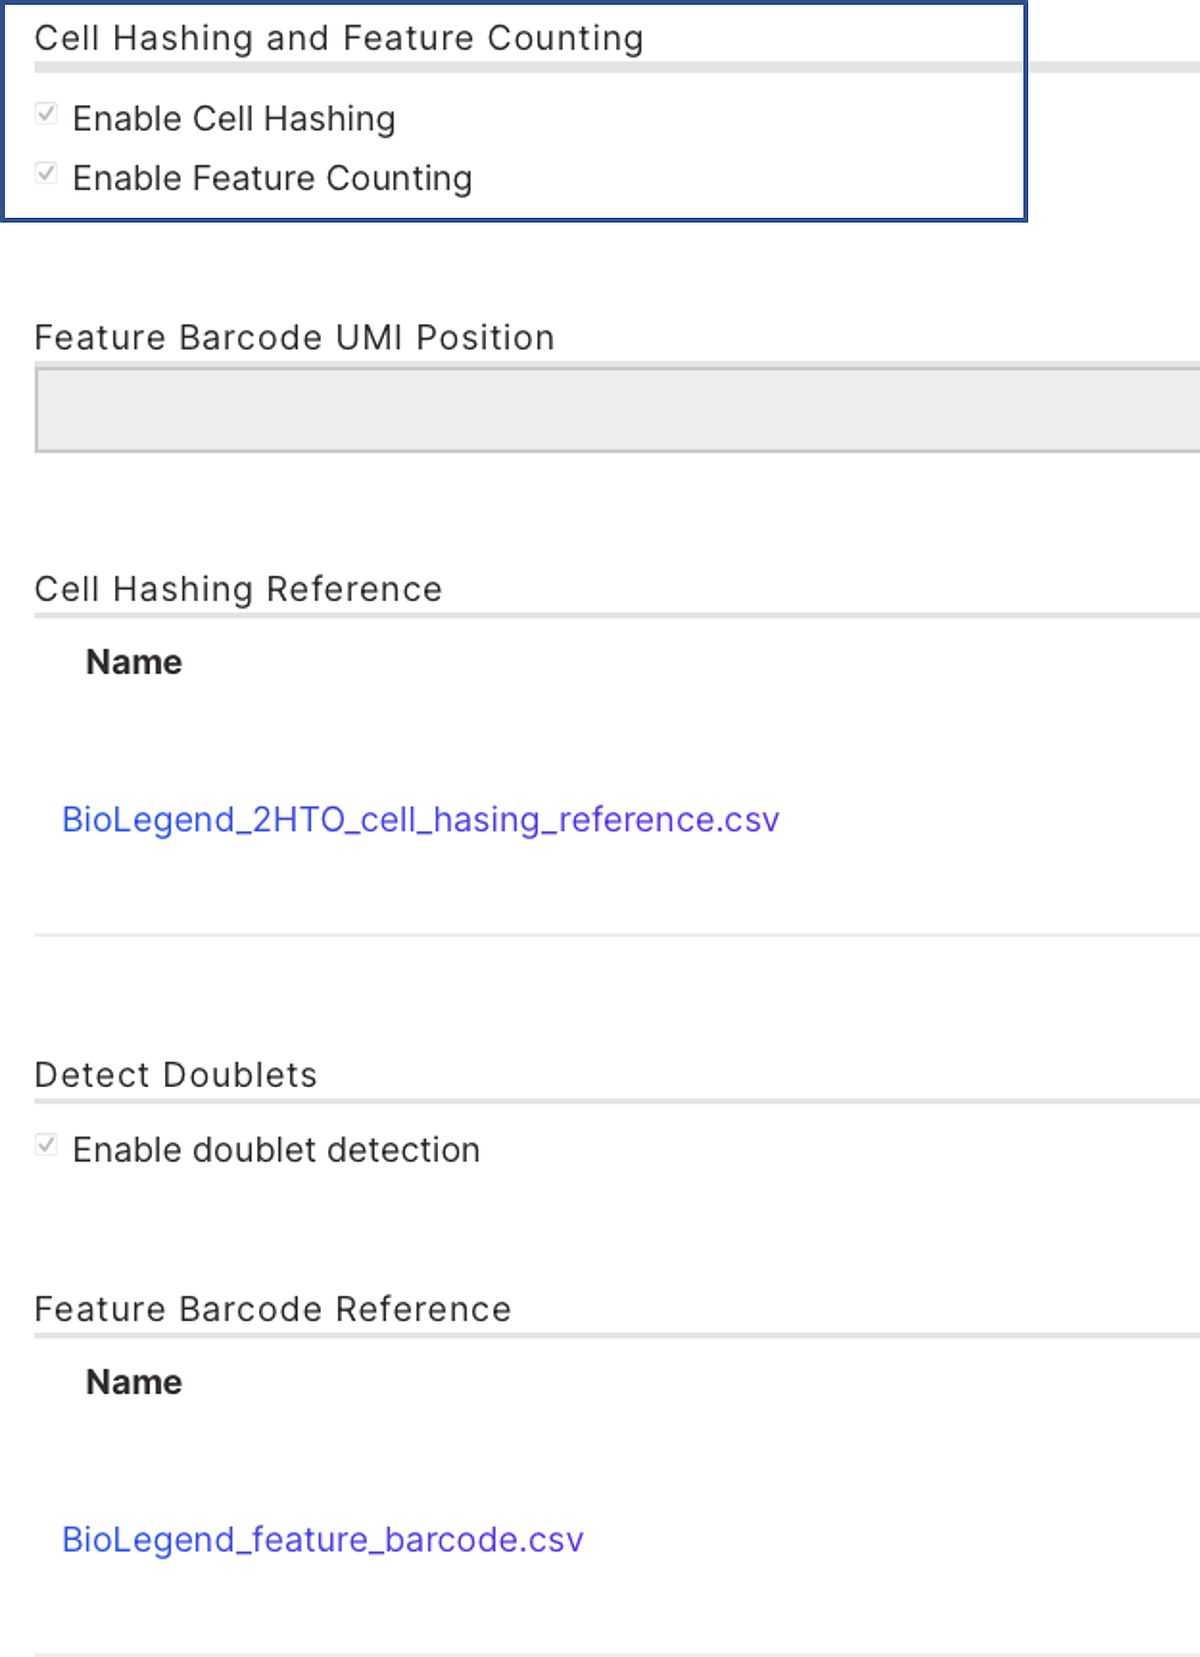
The current DRAGEN scRNA app on BSSH takes a biosample with an aggregated FASTQ file of antibody derived tag (ADT), hashtag oligonucleotide (HTO) and RNA libraries in the same batch, as an input. There are several built-in human reference genomes on the app for easy selection (Figure 2A) and “hg38 No Alts, with decoys" was selected. Single cell RNA library kit 1 is selected from the drop-down menu, which autofills the library structure information. (Figure 2A) Cell hashing reference and feature barcode reference need to follow a certain format with an example shown in Figure 2B and 2C (Note: TotalSeq B and C reagents should have barcode position setting to be 10_15). This 45GB dataset took 1h 11 minutes to complete using BSSH app GUI.
A.
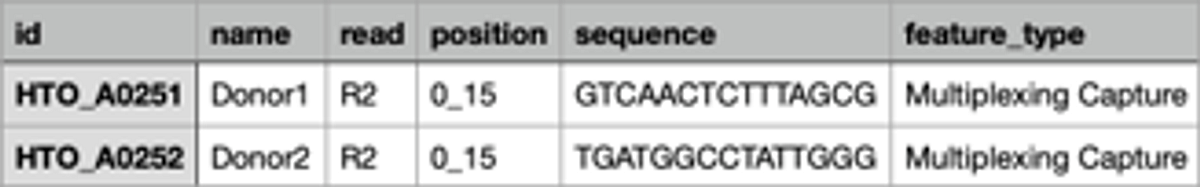
B.
C.
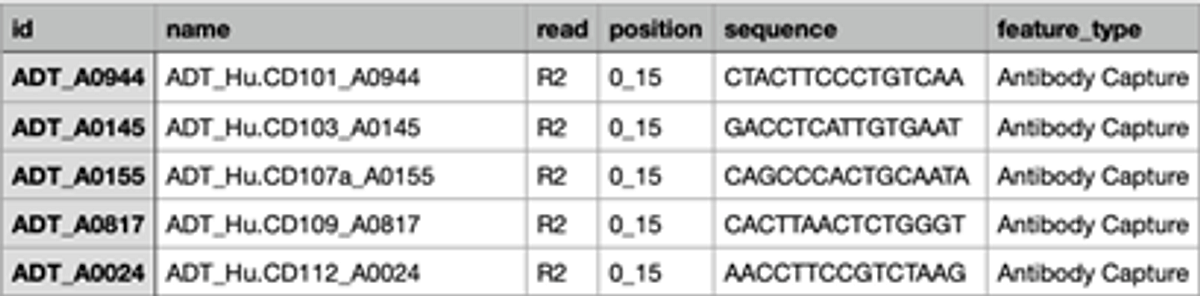
Figure 2: Analysis set up for BioLegend TotalSeq on DRAGEN single cell RNA app. A. A screenshot of the analysis set up page of DRAGEN scRNA app on BSSH. B. A snapshot of file “BioLegend_2HTO_cell_hasing_reference.csv”. C. A snapshot of file “BioLegend_feature_barcode.csv”
The analysis generated two general reports for a quick peek of the data quality and biological information. The first is a MultiQC report, which is a modular tool to aggregate results from bioinformatics analyses across many samples into a single report. The second is a DRAGEN scRNA-Seq report, where it shows UMAP plots of cell clusters (Figure 3), single cell metrics, and mapping metrics. When using TotalSeq hashtags, DRAGEN will display cell hashing which appears in the Sample Demultiplexing Metrics tab.
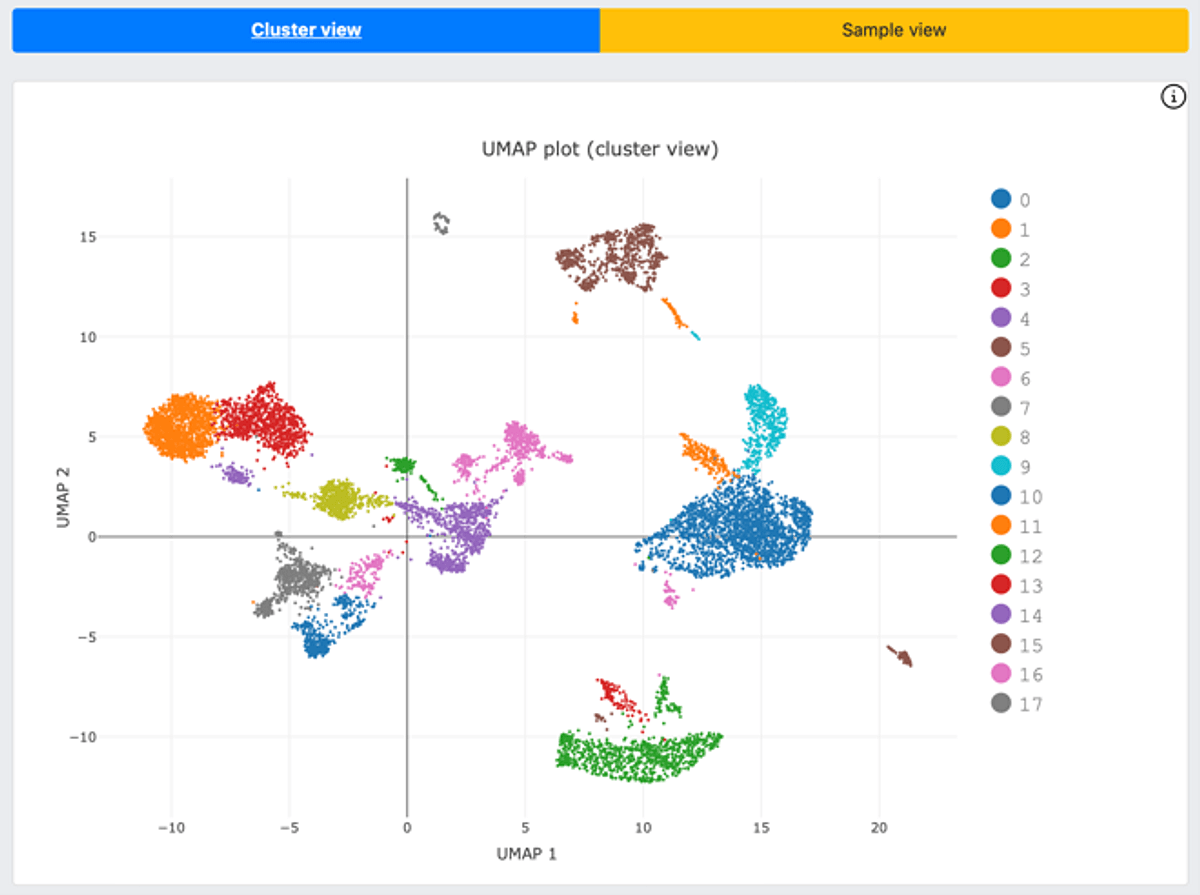
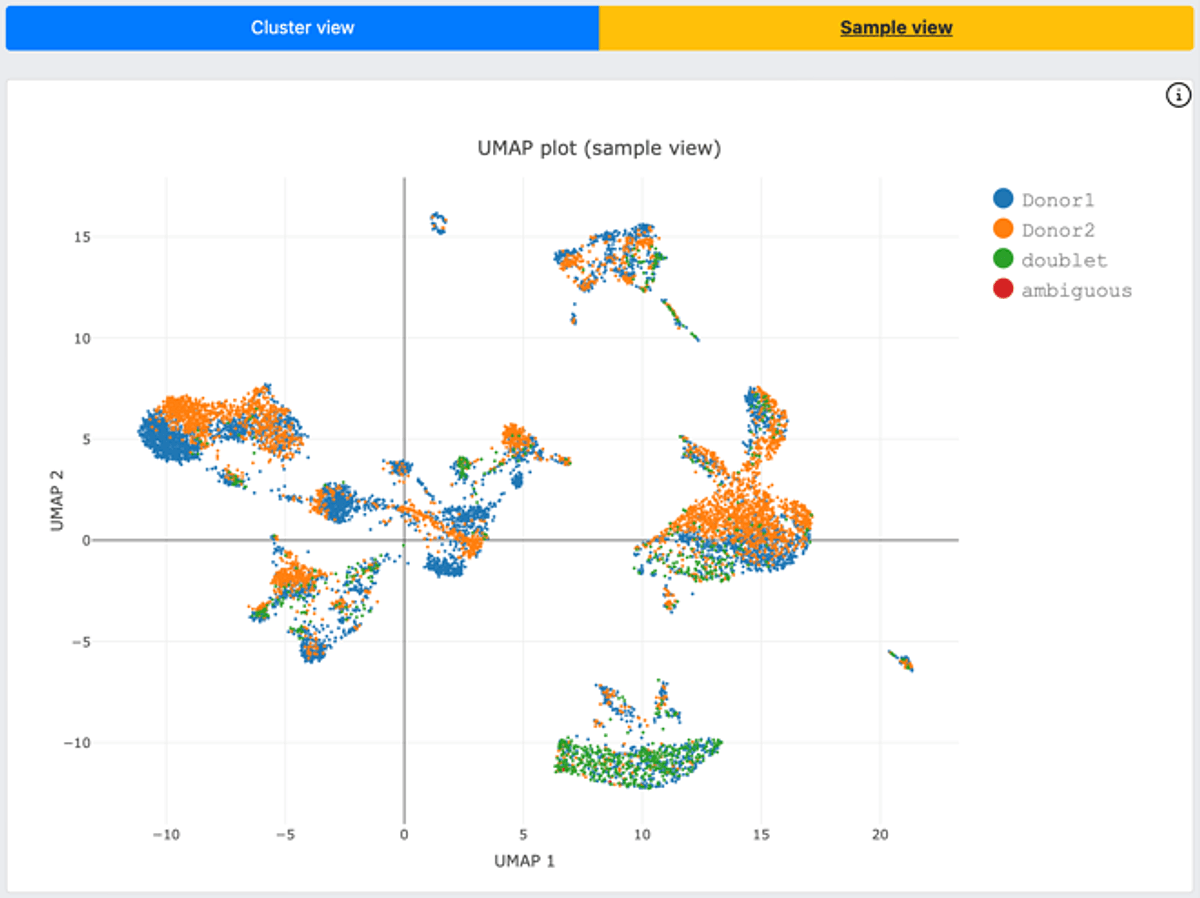
Figure 3. DRAGEN scRNA cell hashing function offers UMAP plots with a cluster view (gene expression, top figure) as well as a sample view (HTO signal, bottom figure).
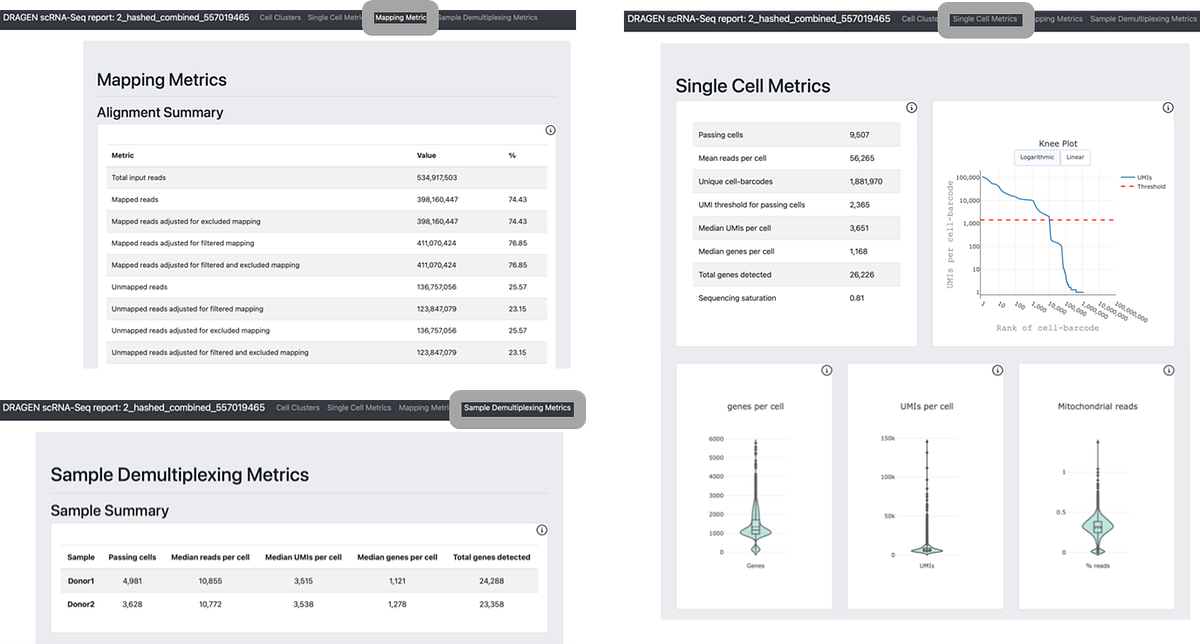
Figure 4. DRAGEN scRNA reports standard single cell metrics, mapping metrics, and genotype demultiplexing. When using TotalSeq hashtag, DRAGEN will display cell hashing which appears in the Sample Demultiplexing Metrics tab.
Lastly, the analysis also generated a standard sparse gene expression matrix output (Figure 5), which can be input for popular tertiary analysis tool such as Seurat and Scanpy. These files are located in a folder named after the input biosample, under tab “Files”. Raw sparse gene expression matrix is also available in the same folder, which renders more flexibility for our customers to apply a different cell calling algorithm.
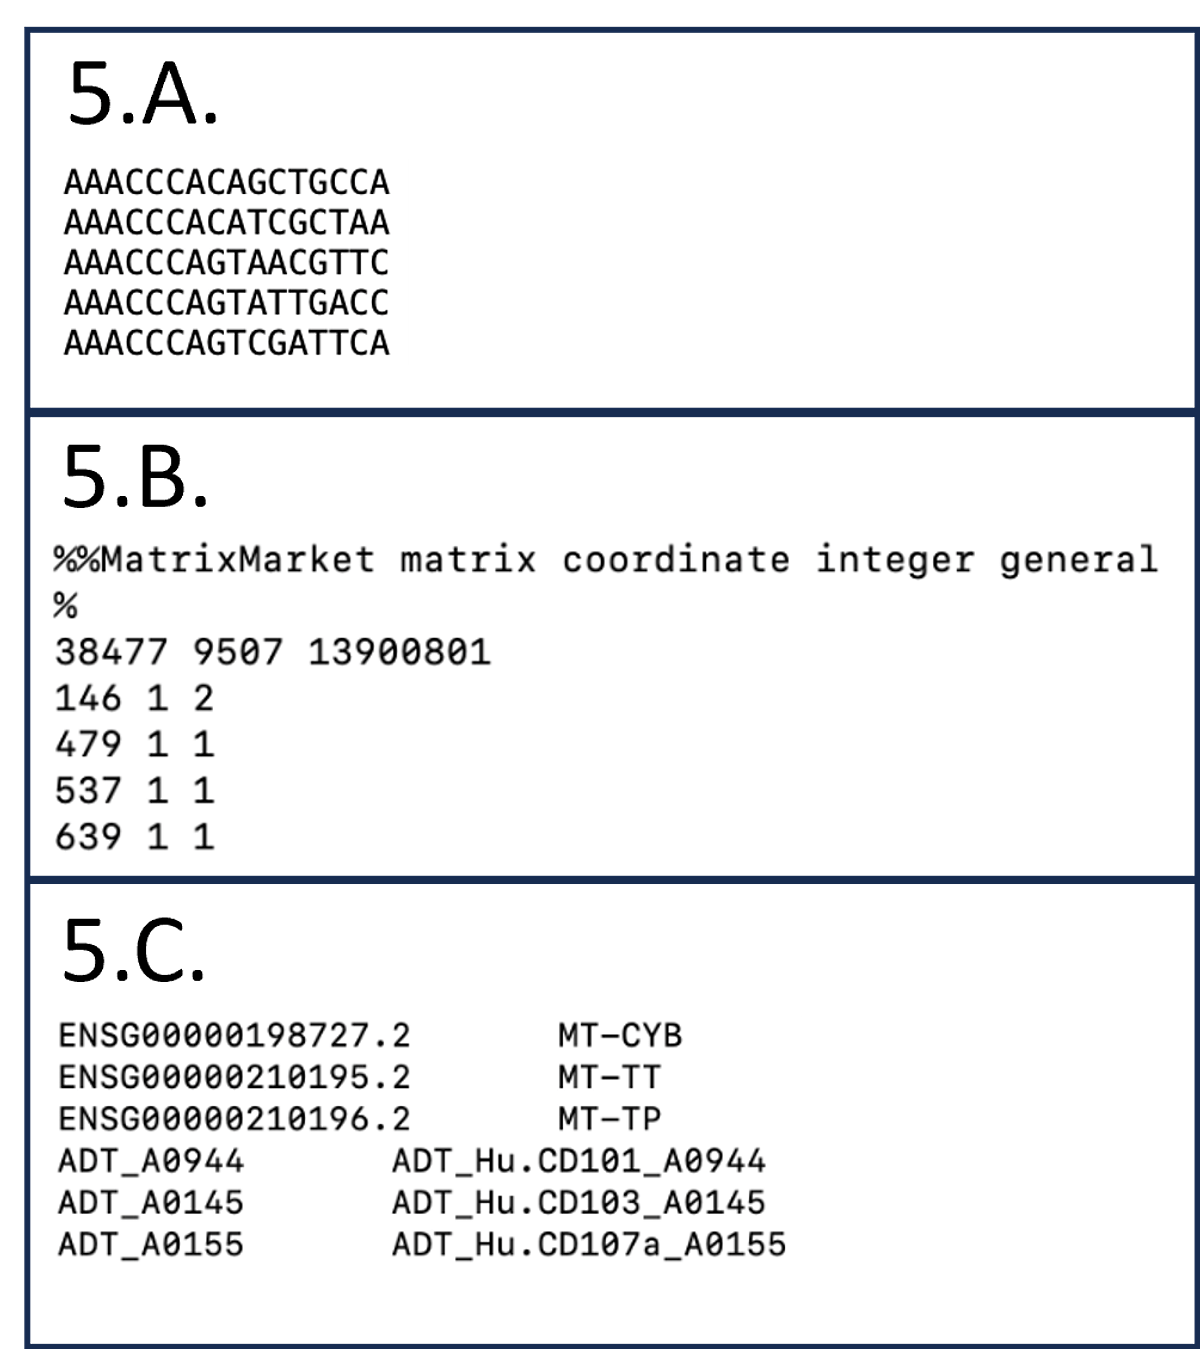
Figure 5. Snapshot of the standard sparse gene matrix files.
5.A. 2_hashed_combined_557019465.scRNA.filtered.barcodes.tsv
5.B. 2_hashed_combined_557019465.scRNA.filtered.matrix.mtx
5.C. 2_hashed_combined_557019465.scRNA.genes.tsv
As a conclusion, DRAGEN scRNA is an accurate and quick analysis method for single cell RNA libraries, and is now compatible with CITE-seq and cell hashing.
Additional resources:
- https://support-docs.illumina.com/SW/DRAGEN_v40/Content/SW/DRAGEN/SingleCellRNA.htm
- https://www.biolegend.com/en-us/totalseq?gclid=Cj0KCQjwnNyUBhCZARIsAI9AYlEQLRfJqipvEJw41tStTZNt1ra9HOra4AOzU3AZCX9gjl1owrlqHnUaArnSEALw_wcB
- https://www.biolegend.com/en-us/cell-hashing-app-note
- https://www.biolegend.com/en-us/protocols/totalseq-a-antibodies-and-cell-hashing-with-10x-single-cell-3-reagent-kit-v3-3-1-protocol
- https://support.illumina.com/content/dam/illumina/gcs/assembled-assets/marketing-literature/biolegend-ben-seq-app-note-m-gl-00024/biolegend-ben-seq-app-note-m-gl-00024.pdf
- https://www.illumina.com/content/dam/illumina/gcs/assembled-assets/marketing-literature/biolegend-totalseq-dilution-application-note-m-gl-00475/biolegend-totalseq-dilution-application-note-m-gl-00475.pdf
- https://developer.illumina.com/news-updates/biolegend-cell-hashing-totalseq-libraries-sequencing-runs-now-available-on-illumina-basespace-sequence-hub
- https://investor.illumina.com/news/press-release-details/2023/Illumina-DRAGEN-4.2-delivers-most-accurate-and-comprehensive-coverage-of-the-genome-powering-greater-applications-and-discovery/default.aspx
- https://developer.illumina.com/news-updates/dragen-4-2-enhanced-machine-learning-new-targeted-callers-and-more
Support
Contact BioLegend for any questions regarding the antibodies and the library prep assay. Contact Illumina Tech support for sequencing related questions and DRAGEN single cell RNA pipeline.
Special thanks to our colleagues at BioLegend for providing all the libraries.
For Research Use Only. Not for use in diagnostic procedures.
M-GL-01682